Hey guys, in this article, I’ll bring my concepts of effective learning into real-world application. I’ll present an actual case of how I utilize DT-Box to conceptualize an idea, develop a trading strategy around it, and then validate this strategy with out-of-sample data. By following the steps I describe, you’ll get hands-on experience with all of DT-Box’s features and gain the confidence to explore your own trading ideas independently. If you’re seeking a comprehensive understanding of DT-Box’s capabilities, here’s where you can access the complete user guide for the latest version.
Now, let’s begin with the first step: defining the idea we intend to test. In our scenario, it’s a loosely defined price pattern that we expect could be profitable. Next, we’ll launch our first DT-Box-powered backtesting experiment to select indicators that might help us pinpoint our pattern. By combining these indicators, we’ll establish specific entry and exit criteria.
In the subsequent phase, we’ll conduct another round of backtesting experiments, this time focusing on opening and closing positions to evaluate the preliminary outcomes of our strategy. Through iterative backtesting experiments and a process of trial and error, we’ll uncover additional rules and filters that refine our initial concept into a comprehensive trading model. The final step involves conducting an out-of-sample test to validate our strategy’s effectiveness.
In order to get a better understanding of the process, I suggest for you to try to reproduce the steps I describe in this article while you are reading. With repeating my steps you will come up with own ideas and rules, so do not hesitate to experiment, after all, coloring outside the lines is always more fun. Essentially, this is what DT-Box is built for – enabling you to try as many new ideas as possible in the most convenient way.
To get better understanding of the process, I recommend attempting to replicate the steps outlined in this article as you read. By mirroring my approach, you’ll naturally develop your own ideas and rules. Don’t shy away from experimenting – after all, going beyond the conventional boundaries often leads to the most exciting discoveries. This is precisely what DT-Box is designed for – to facilitate the exploration of numerous new concepts in the easiest and most efficient manner possible.
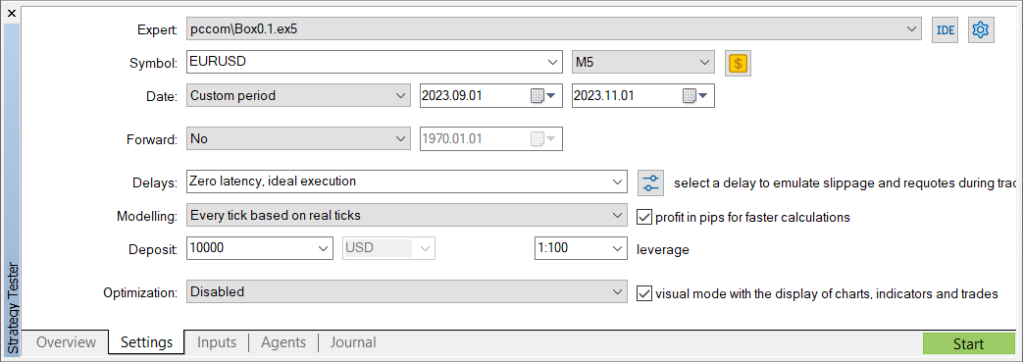
For this article I will use the EURUSD symbol on the M5 timeframe from Sep 1, 2023 to Oct 30, 2023.
Step 1 – Defining the idea
Let’s formulate the concept that we aim to transform into a profitable strategy. Here is my trading hypothesis, which I believe has the potential to be profitable and intend to validate and evolve into a functional trading model: whenever the price increases (or decreases) abnormally quickly, it will subsequently revert. On a chart, this could appear as follows:
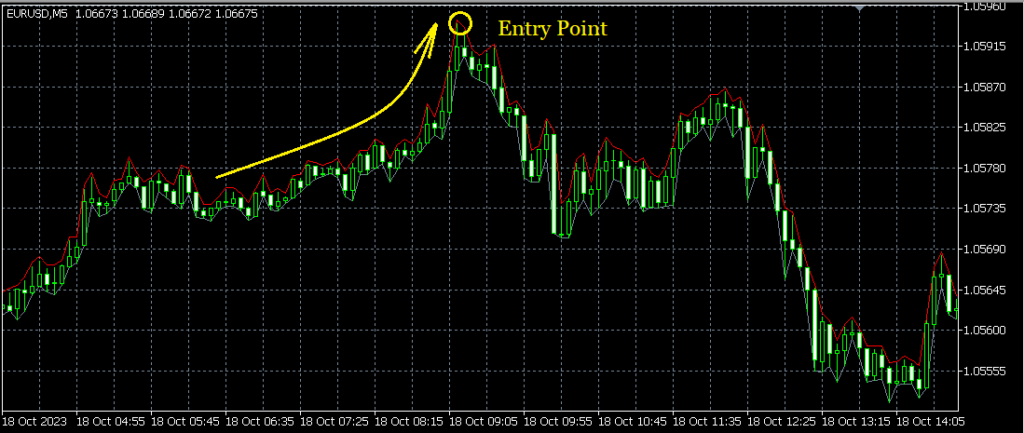
And as follows:
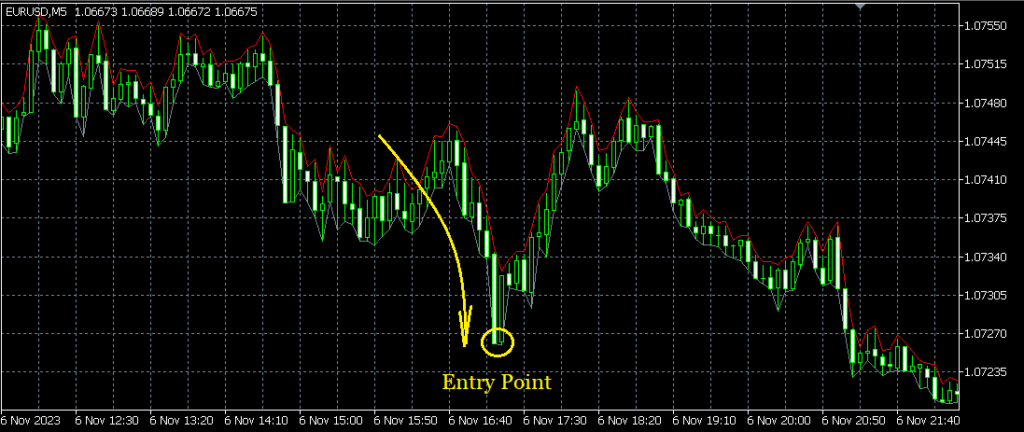
And also this way:
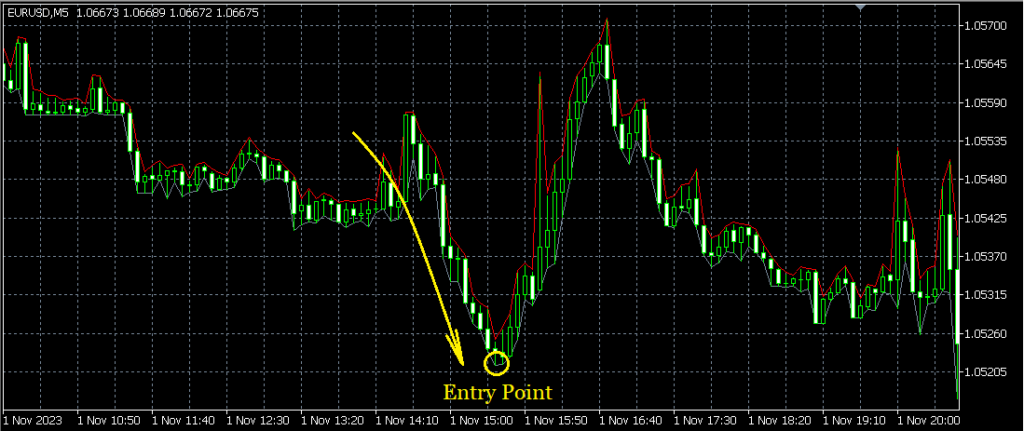
As mentioned earlier, this is merely a preliminary observation from reviewing the M5 charts. In the subsequent steps, we will attempt to validate this observation and establish precise rules that will form the basis of our trading model.
Step 2 – The first backtesting, picking up indicators, defining entry/exit rules
This will be our first DT-Box-powered backtesting. We’ll identify appropriate patterns on the chart and, by adding and adjusting indicators in real time, we’ll derive the essential combinations needed for buy and sell, entry and exit signals.
If you’re following along with these steps, please ensure you understand how to install and setup the MT5 strategy tester with DT-Box.
First, let’s open the DT-Box app, then configure and launch the strategy tester in visual mode:
Right after the start, put strategy tester on pause and set comfortable history play speed:

Typically, I use the backtester at one-third of the maximum speed and always pause it before performing any actions, such as adding, modifying, or removing indicators, or sending orders from DT-Box.
Now, let’s add some indicators that will more accurately capture the price pattern we’re aiming to identify. In version 0.1, there are 10 indicators available. More will be added in upcoming versions, so stay tuned.
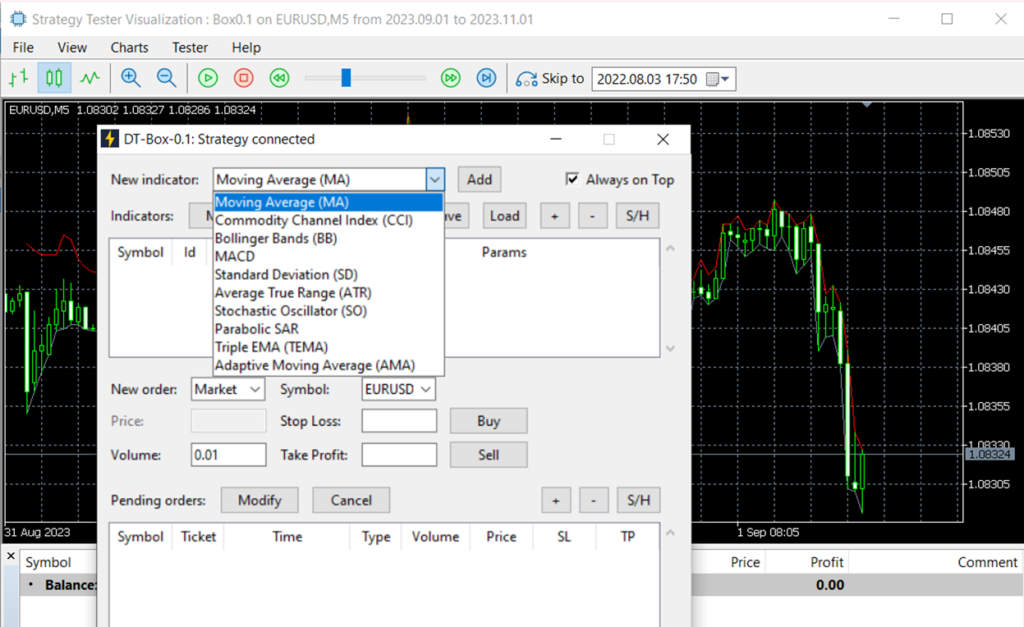
Here’s my approach to selecting the right indicators: during backtesting, I identify two or three patterns on the chart that I aim to detect using indicators. Then, I begin adding different indicators one by one, adjusting their parameters to determine which best suits my needs.
However, there’s a nuance to be aware of: the strategy running in the strategy tester responds to commands from DT-Box only upon receiving the next tick. For instance, when you add a moving average through DT-Box, the corresponding command is dispatched to the strategy, which then displays the moving average on the backtester’s chart. But, the strategy reacts only to price data events during backtesting. Thus, if the backtester is paused — meaning no new price data is being received — the strategy won’t process any incoming commands. Any commands sent are queued and will only be executed once backtesting resumes.
You can also set the backtesting speed to very low, ensuring just a few ticks per second. This approach guarantees that any modifications to the indicators will be displayed almost instantly.
Alright, now let’s add moving average indicator and determine if it is useful in our scenario:
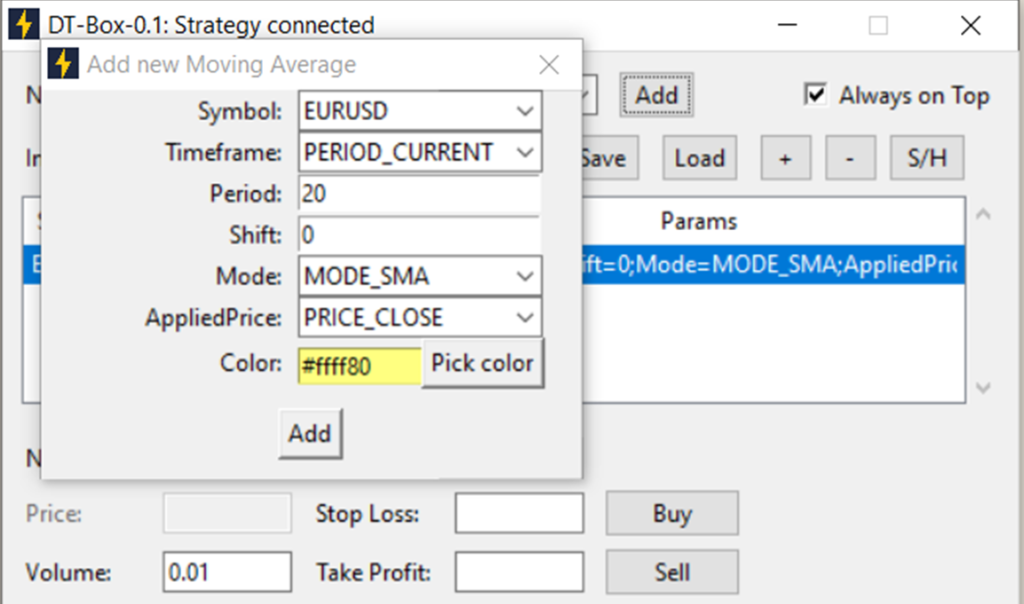
After you click Add button, the indicator will appear on the chart:
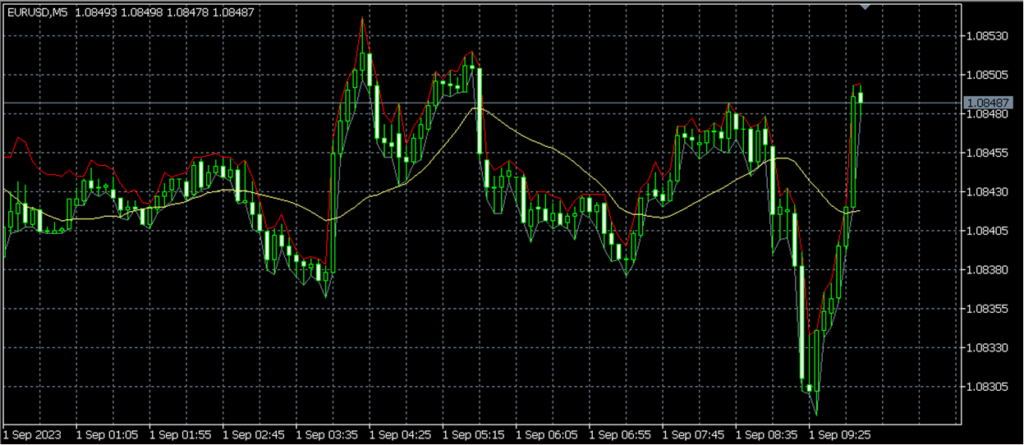
This chart has two instances of the pattern I aim to detect: one represents a short trade, and the other a long trade:
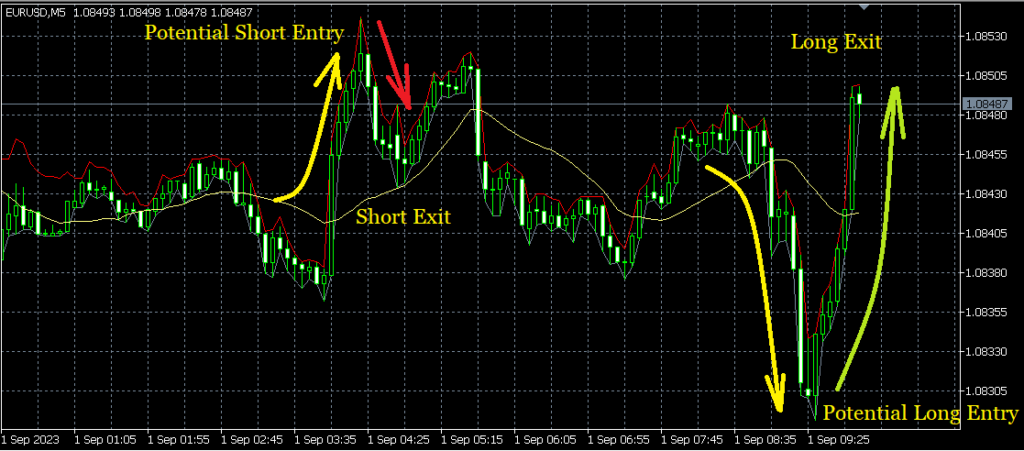
Although the added moving average doesn’t assist in pinpointing the exact entry point, it does help illustrate that the price significantly deviates from a certain average value. I will now tweak its period settings to find a more suitable configuration.
Let’s increase the period to 200. In the DT-Box indicators table, select the moving average and click the ‘Modify’ button:

Enter 200 for the period and click ‘Modify.’ Upon the next tick, the chart window will update to look as follows:
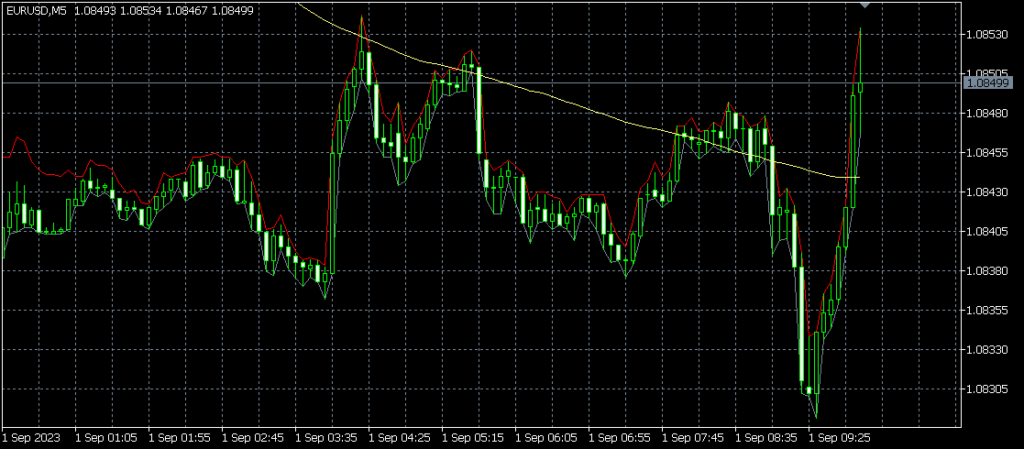
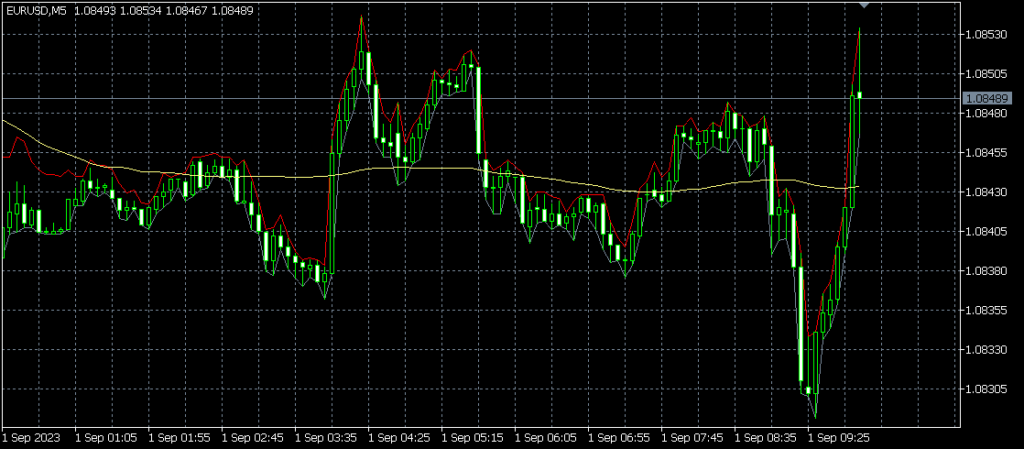
Let’s decrease the period and make it 100:
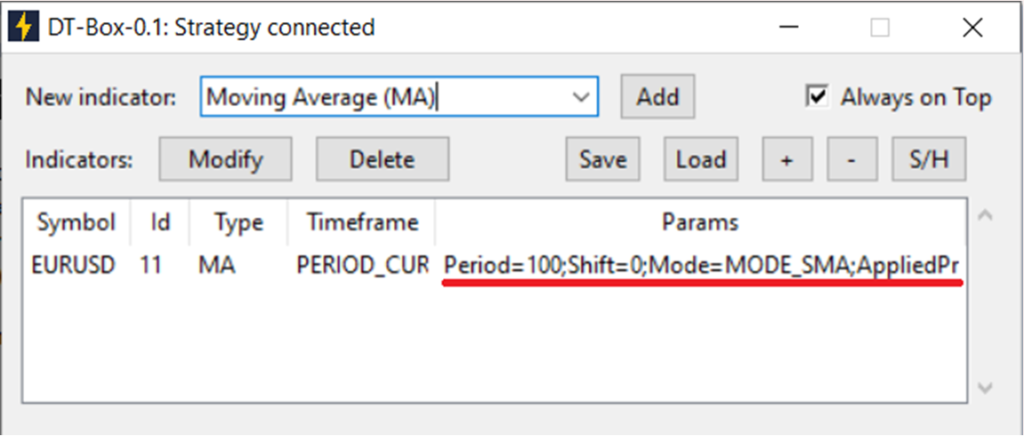
You can always see indicator parameters in DT-Box table:
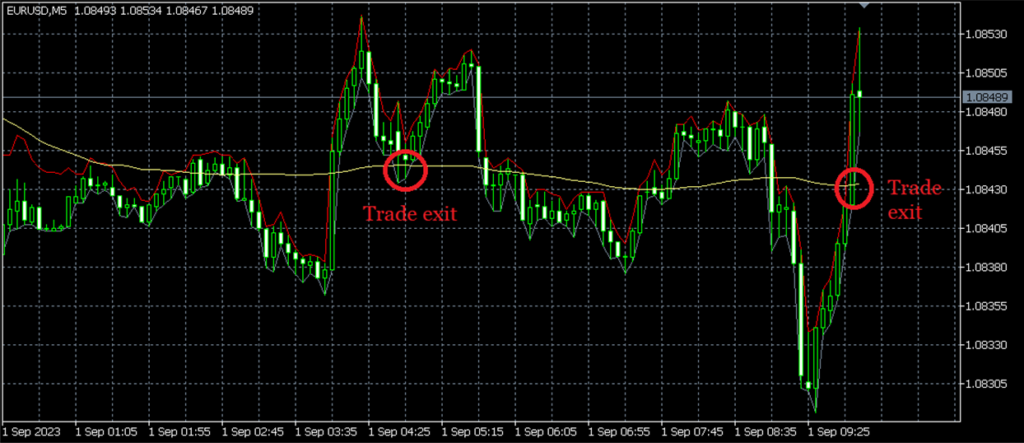
Experimenting with the MA also aids in generating ideas for trade exits – when the price returns to its average value, we can consider closing the trade:
Keep in mind that in this example, our goal isn’t to discover some hidden secret to profitable trading; we’re simply choosing tools that facilitate practice in backtesting mode. This will ultimately help us establish clearer entry and exit criteria through a process of trial and error. In other words, the aim isn’t necessarily to become experts at selecting indicators but to improve our learning process. So, when you test your own ideas, don’t spend too much time on this phase – just select indicators that seem good enough to begin with. The process of improvement is ongoing; it can never be completed, only halted.
DT-Box has several types of moving average indicators, and you can add, remove, and modify any of them while backtesting is running. For example, here I’ve added the Triple Moving Average and Adaptive Moving Average, both set to a period of 100:
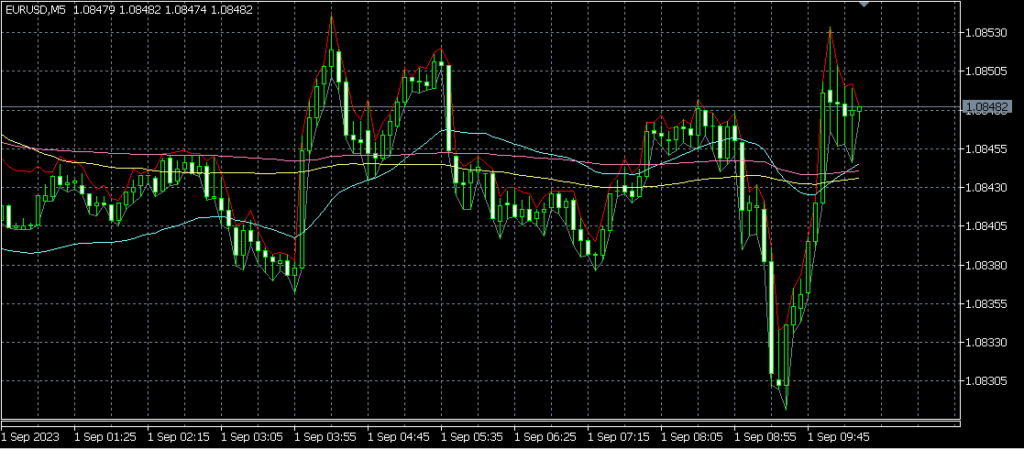
In DT-Box app it will look like this:

After experimenting a few times more, I’ve decided to stick with a simple MA indicator set to a period of 100 and have removed the others.
Now, I aim to define the entry rule — I need indicators that identify price peaks following a sharp increase or decrease. Oscillators are typically used for this purpose as they indicate when the price is above (or below) a certain average level and measure the extent of its deviation. For example, let’s add the CCI indicator with its default parameters:
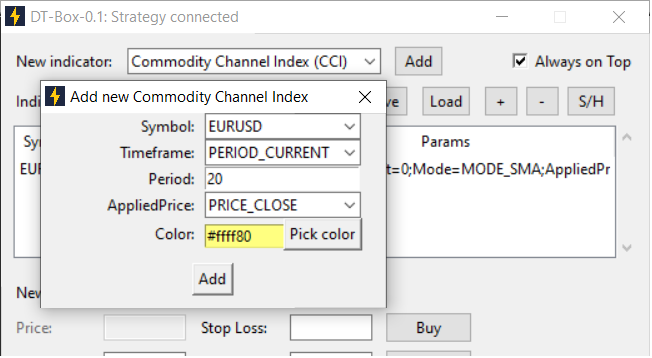
And it will be displayed on the strategy testers chart:
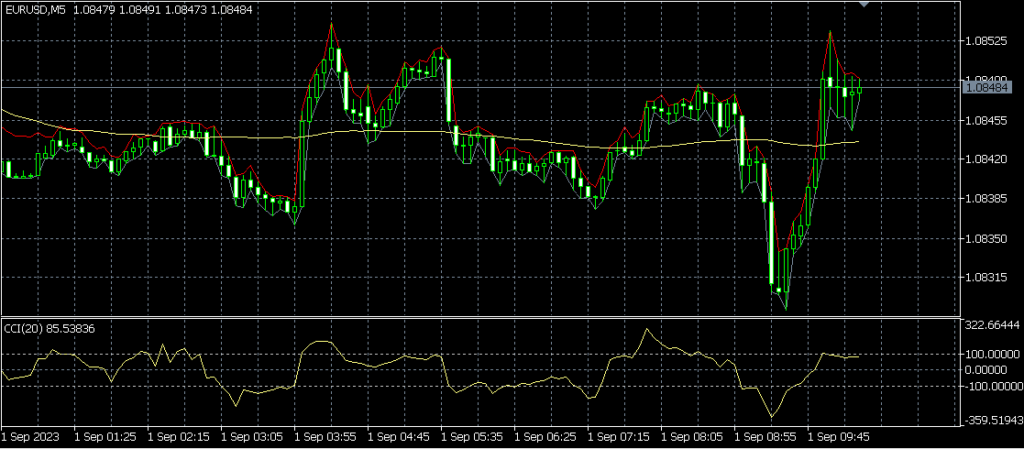
Because the CCI (and similar indicators) oscillate around zero level, we now can compare price peaks to one another:
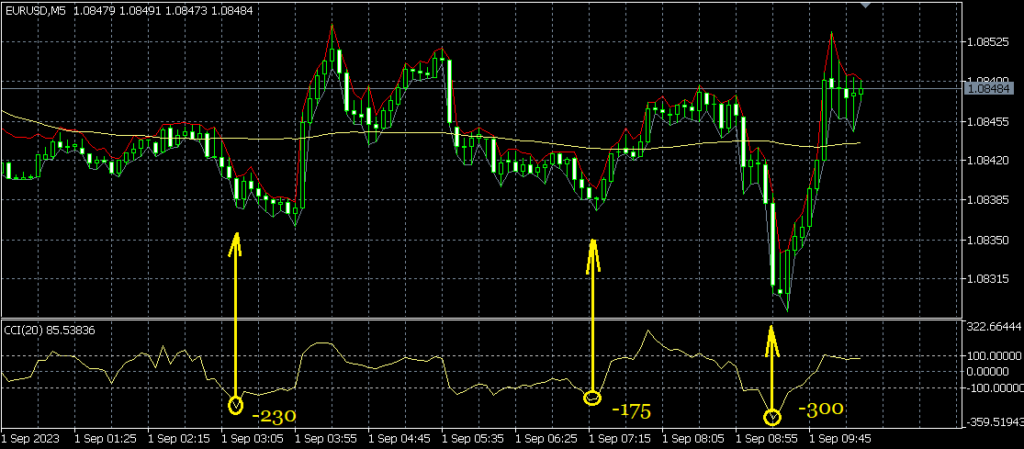
Now I can formulate the second rule – in order to enter a long (short) position CCI indicator value has to reach -300 (+300) points. We can later review the exact value, but on that stage -300 (+300) seems reasonable to me.
Now we need to define the exact entry rule, as you can see from the chart, after CCI reaches local min/max the price normally continues to go in the same direction. So how do we tell when the right entry moment is?
Now, I can establish the second rule: to enter a long (short) position, the CCI indicator value must hit -300 (+300) points. We might revisit this specific threshold later, but at this stage, -300 (+300) appears to be a reasonable benchmark.
Next, we need to pinpoint the precise entry rule. As observed in the chart, after the CCI hits a local minimum or maximum, the price typically goes in the same direction. So how do we determine the optimal entry moment?
Let’s try standard deviation indicator with default parameters:

When you click Add, our chart will look as follows:
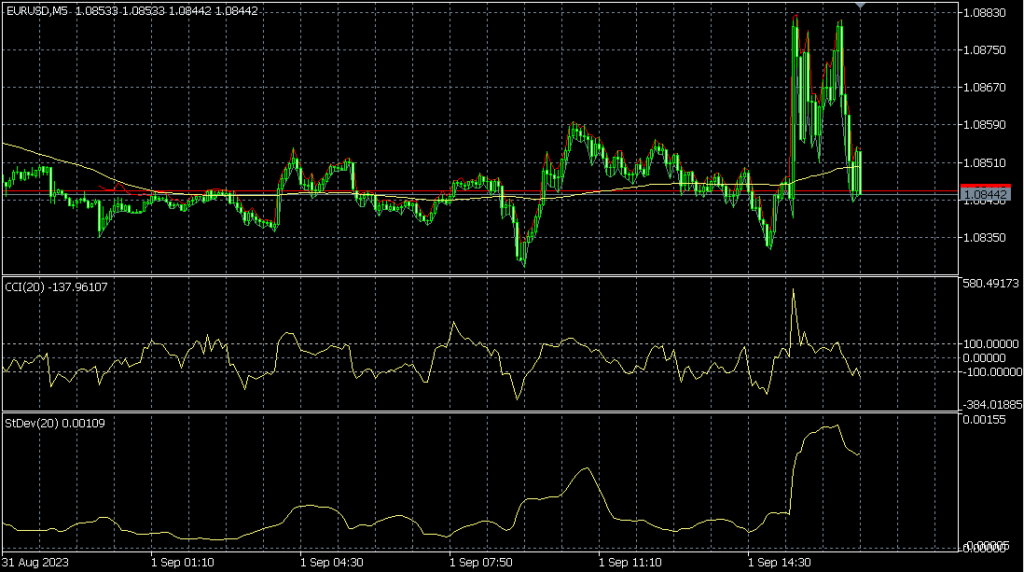
After observing the fluctuations in price and indicator changes in several use cases, I’ve identified my next condition: my entry point occurs when the standard deviation begins to decrease after reaching a local maximum.
Here is an example:
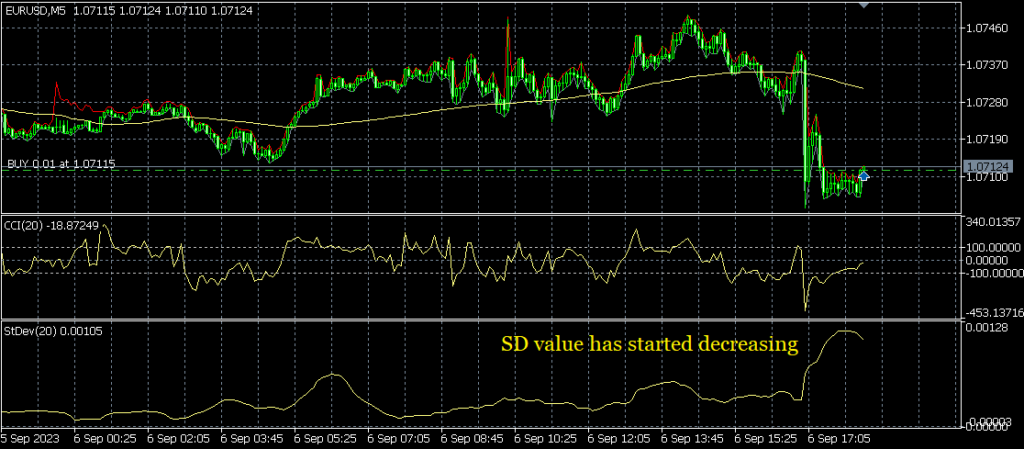
Now, let’s summarize our rules based on the indicators we’ve selected:
1. For a long (short) signal, the price should be below (above) the simple moving average.
2. The CCI indicator should reach -300 (+300) before we enter a long (short) trade.
3. The standard deviation (SD) indicator should start decreasing after reaching a maximum before we enter a long (short) trade.
4. We close a trade when the price returns to (or becomes equal to) the MA value.
Step 3 – Refining Entry/Exit Rules Through Trial and Error
Now let’s go to the next phase, where we’ll implement the defined rules to enter and close trades. We’ll resume backtesting, entering a position whenever rules 1, 2, and 3 met, and waiting for rule 4 to signal an exit. By observing the outcomes of each trade, whether a loss or a profit, we’ll identify additional filtering rules to enhance our strategy and develop a more concrete trading model.
A quick note before we proceed: You might think, why not just write some MQL5 code and backtest the strategy since all the rules are quantifiable? While this approach seems logical, it’s not the most enlightening. Sure, you could spend time fine-tuning strategy code, indicator settings, stop loss margins, and take profit points, but you might abandon the strategy due to early losses before seeing any real gains. However, applying these rules manually within our simulated environment allows us to uncover new rules which eventually will make manual strategy profitable. In other words, immediate automation may only bring incremental improvements, whereas manual testing in this context can lead to the discovery of better trading rules.
One more note regarding using technical indicators, keep in mind that indicators do not predict price movements, they simply indicate a certain current state of the market relative to its past. And in regards to our scenario, by using a combination of indicators we are trying to catch the point when the price went sharply away from some average level.
Let’s play historical data further and find the next occasion which corresponds to our rules. This moment seems to satisfy all our conditions:
Another point to remember about using technical indicators: they don’t predict price movements, instead, they merely signal the current market condition in relation to its past. In the context of our scenario, by employing a mix of indicators, we aim to identify moments when the price significantly deviates from an average level.
Let’s continue examining historical data to find the next instance that meets our criteria. This particular moment appears to fulfill all our conditions:
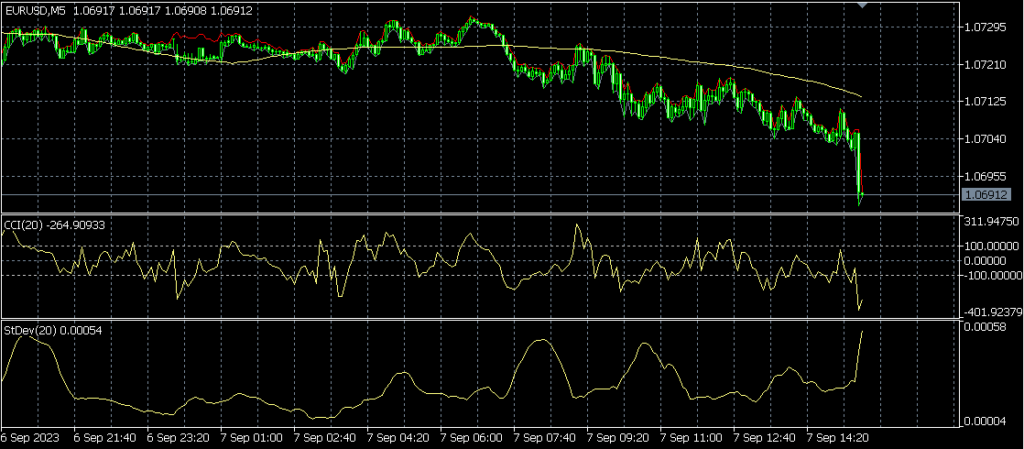
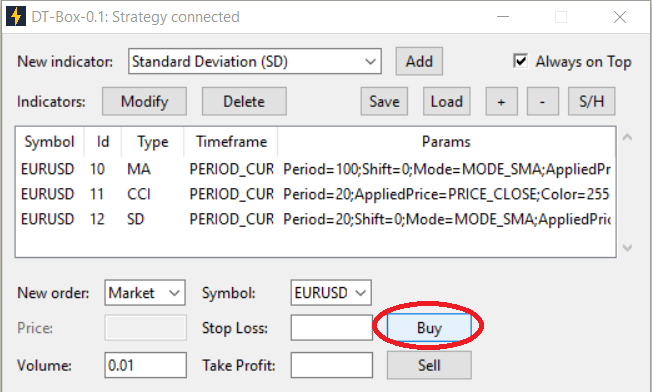
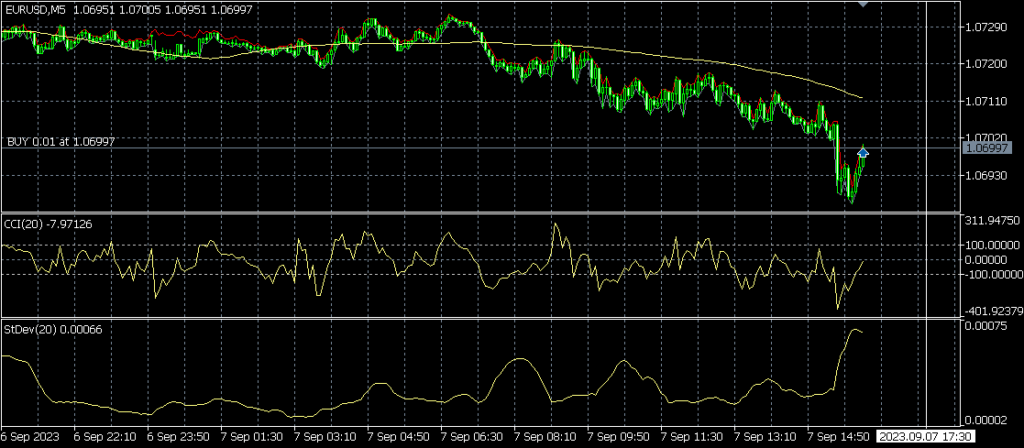
The price is significantly distant from the average, the CCI indicator is below -300, and the standard deviation is increasing, meaning rules 1 and 2 are satisfied. Now, we’ll wait for the standard deviation to start decreasing before entering the position. We’ll execute market orders with the smallest possible volume and without stop loss (these are just the default settings). Click the ‘Buy’ button, and a buy market order will be sent to the simulator:
You will see open position on the chart:
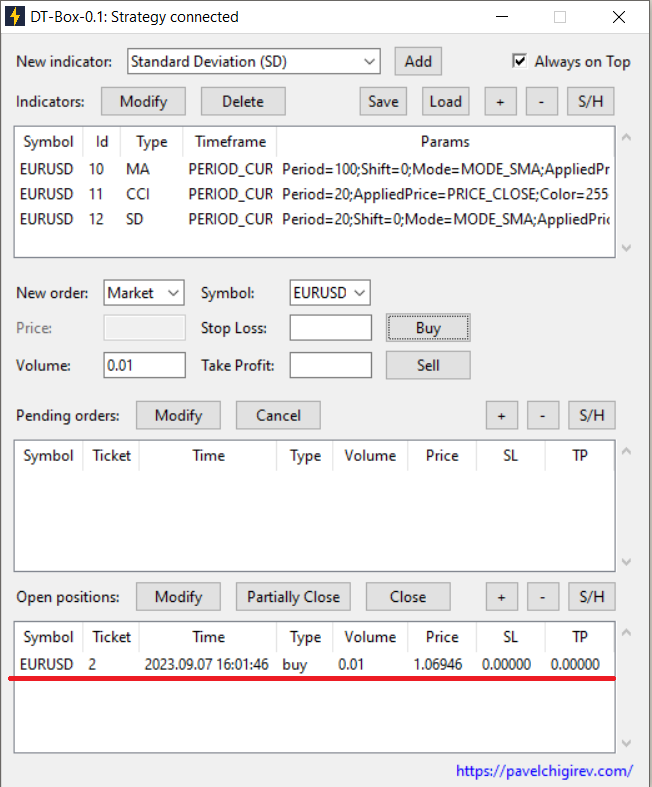
DT-Box open position table will also contain a row indicating open position:
I strongly recommend conducting all operations via DT-Box while the strategy tester is paused. I’ve made numerous errors and lost considerable time by trying to add indicators or place orders while the simulation was active. Remember, prices in the simulation move much faster than they do in real-time, and learning to react faster is not beneficial. After all, we are here to learn, not to engage in a blitz chess match. The more you focus consciously on each scenario, the steeper your learning curve will be.
I typically set the simulation speed to one-third of the maximum to identify the price point that satisfies rules 1 and 2. Then, I reduce the speed to one-fifth and wait for rule 3 to be fulfilled. Once it’s met, I pause the strategy tester, switch to DT-Box to execute an order, and then press F12 (or click the ‘Step by step’ button), which advances the simulation by one historical tick and allows the strategy to process the order command:
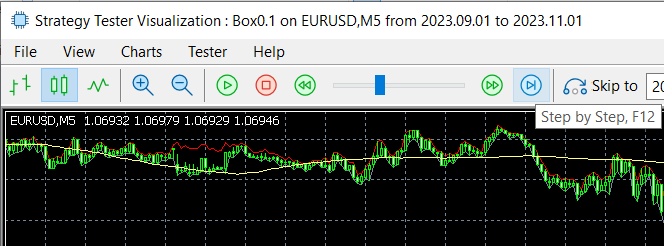
You might choose to approach this differently, but as previously mentioned, try to avoid conducting these operations at a high simulation speed.
Now, with our first order placed, let’s wait for the exit condition of rule 4 to be met. When the price crosses above the MA indicator, pause the strategy tester, select the position in the DT-Box positions table, and click ‘Close’. Then press F12 in the strategy tester to process the command. The chart will then update to reflect this action as follows:
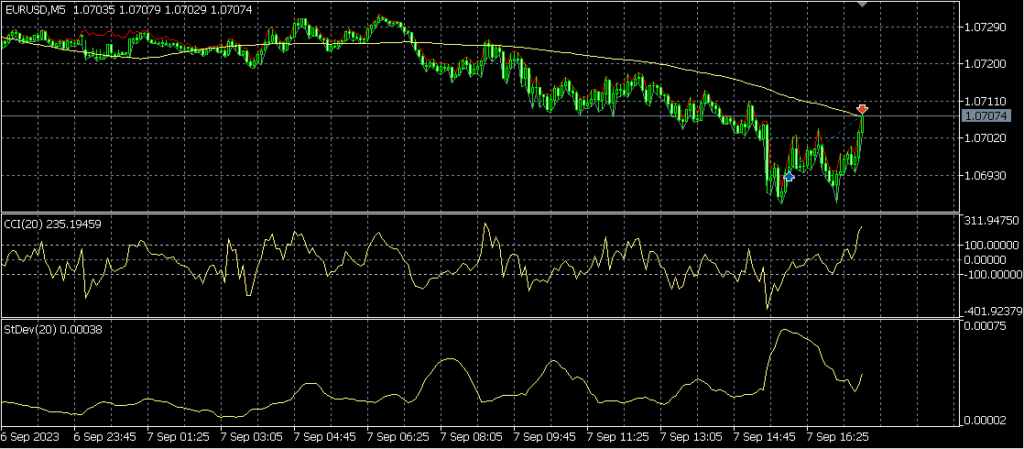
Looks pretty cool, right? Now, let’s identify the next opportunity in the same manner. The following scenario appears quite promising, even though the CCI is only around 280:
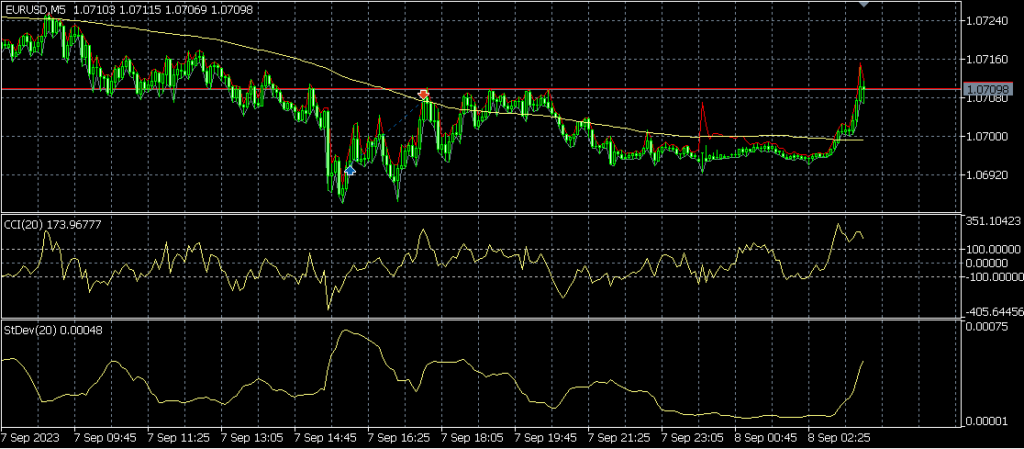
Let’s wait for the SD (Standard Deviation) indicator to start decreasing before we enter a short position:
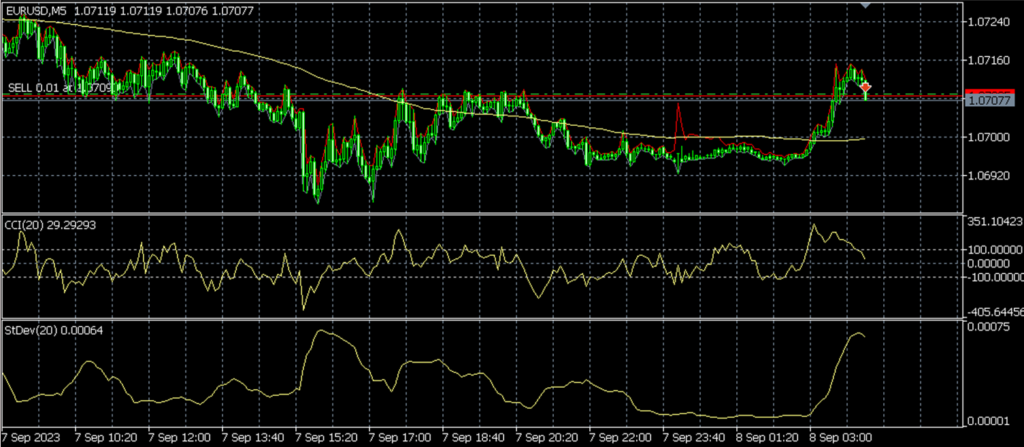
Let’s wait and see what happens. In this instance, the price moved against our position:
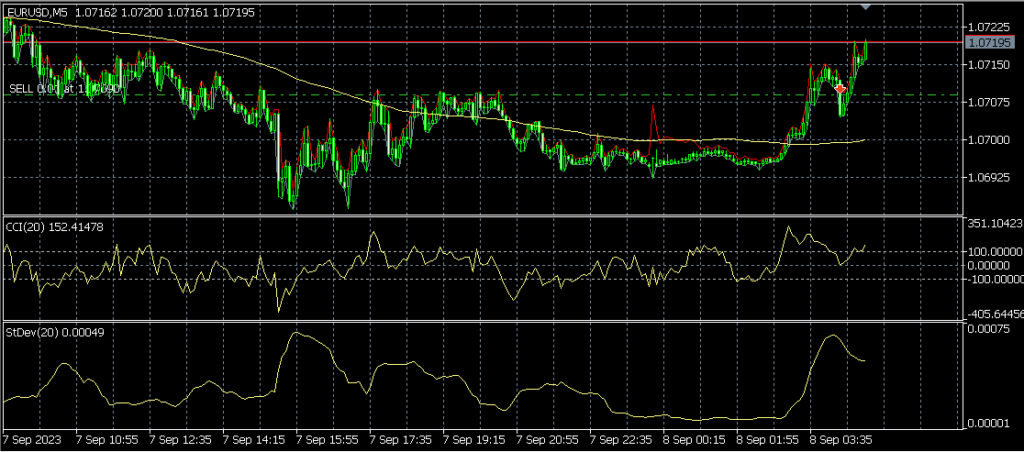
Now we need to decide how to handle this situation: close the position now, wait to close later, or perhaps open another short position – the price will reverse, we just have to believe, if you know what I mean 🙂 In this scenario, I would recommend closing it now since the price has risen above the local maximum:
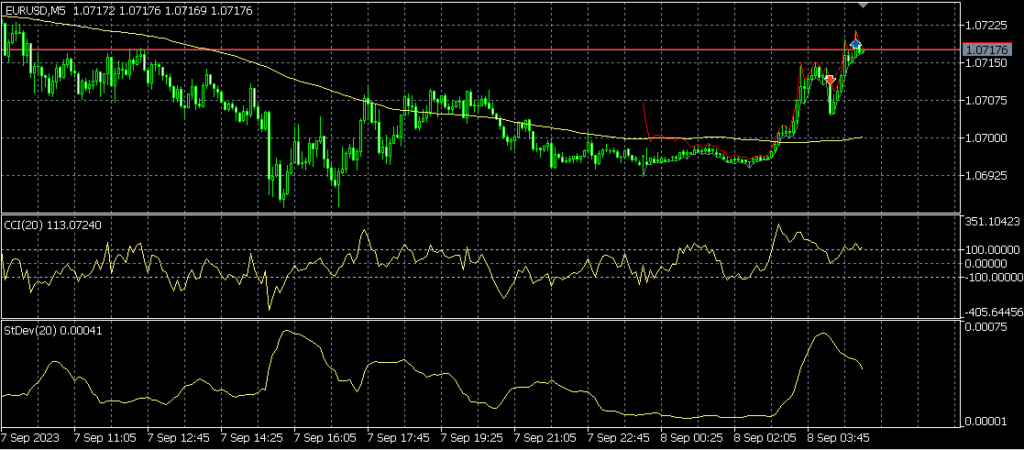
For our next order, let’s plan to set the stop loss at the local minimum (maximum) price. Here is our next potential entry that satisfies rules 1 and 2:
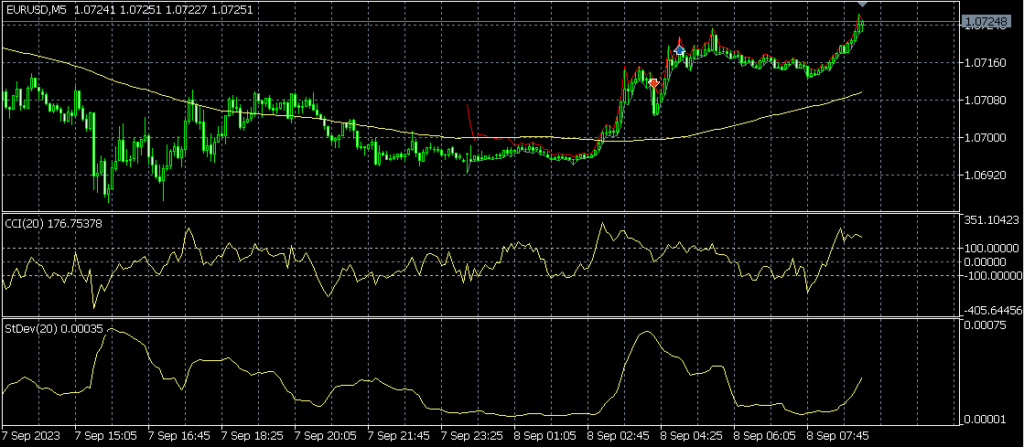
Let’s wait for rule 3 and then send sell market order with stop loss:
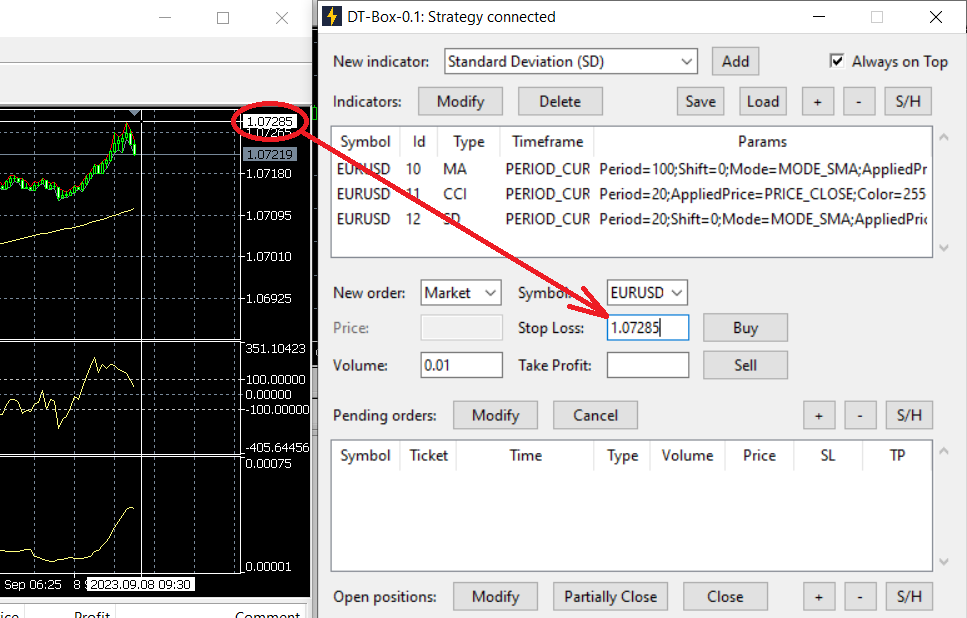
When we click Sell button and resume simulation, our sell order appears on the chart:
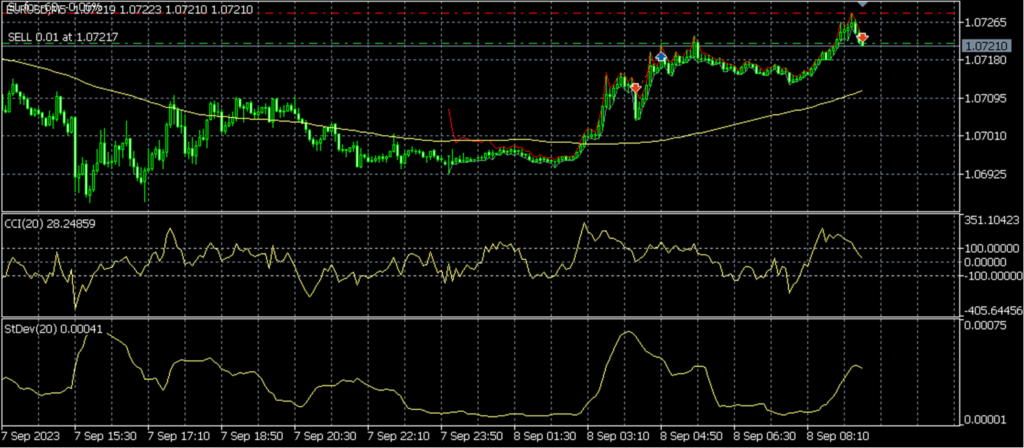
Let’s wait for the trade to exit according to rule 4. Meanwhile, we don’t need to worry if the price moves against us:
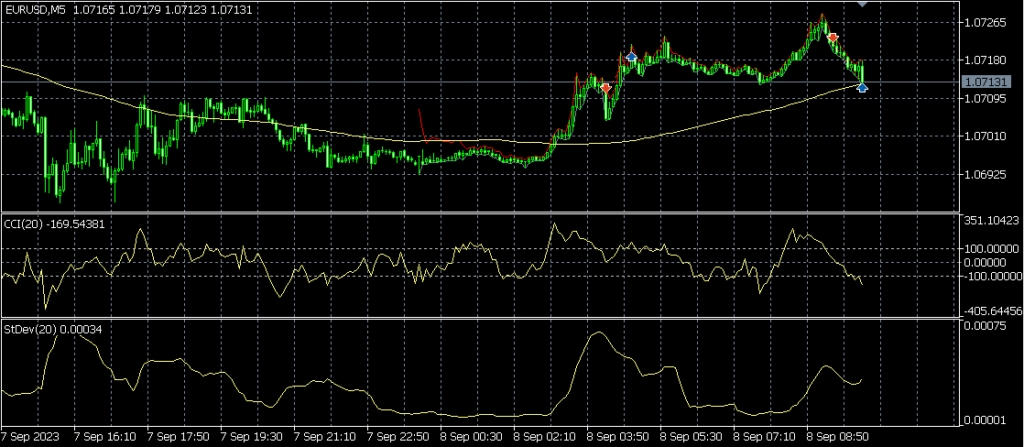
Let’s proceed in the same manner and initiate a few more trades, each with a stop loss. Entry:
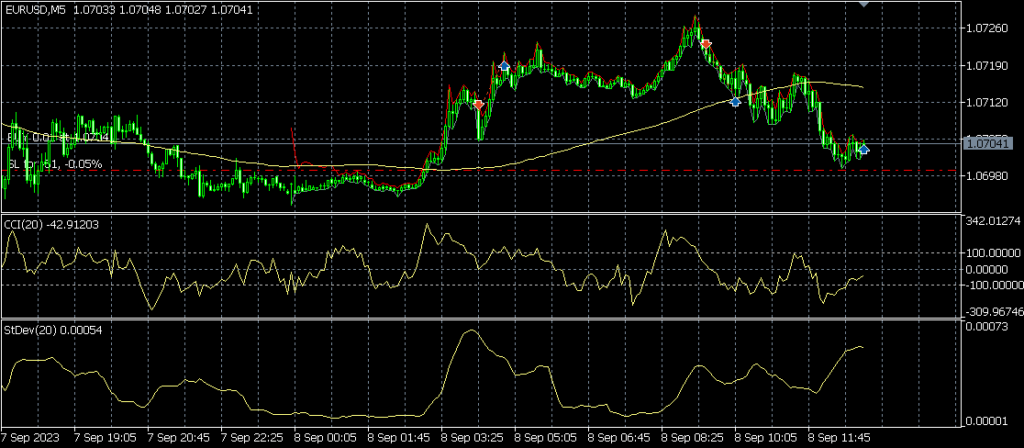
Exit:
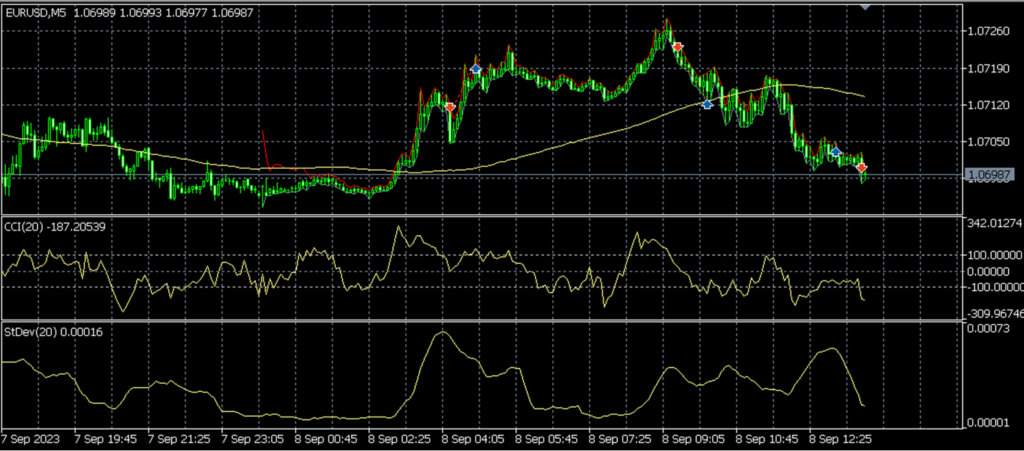
Entry:
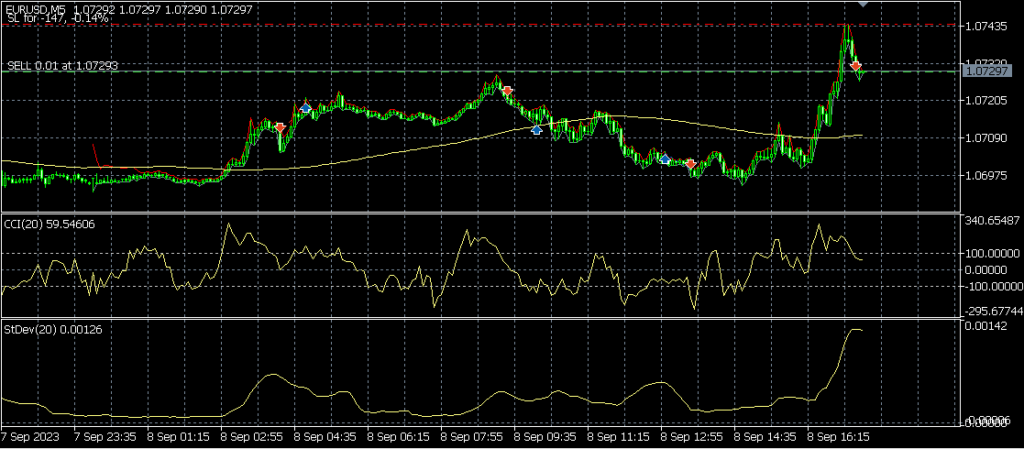
Exit:
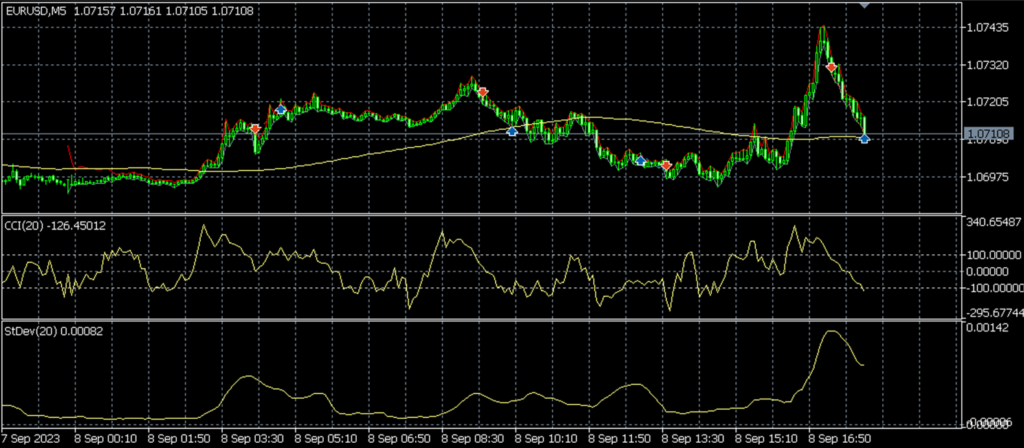
Here’s another interesting scenario: rules 1, 2, and 3 have been met, but the price is currently at its peak, leaving me without clear criteria to set a stop loss:
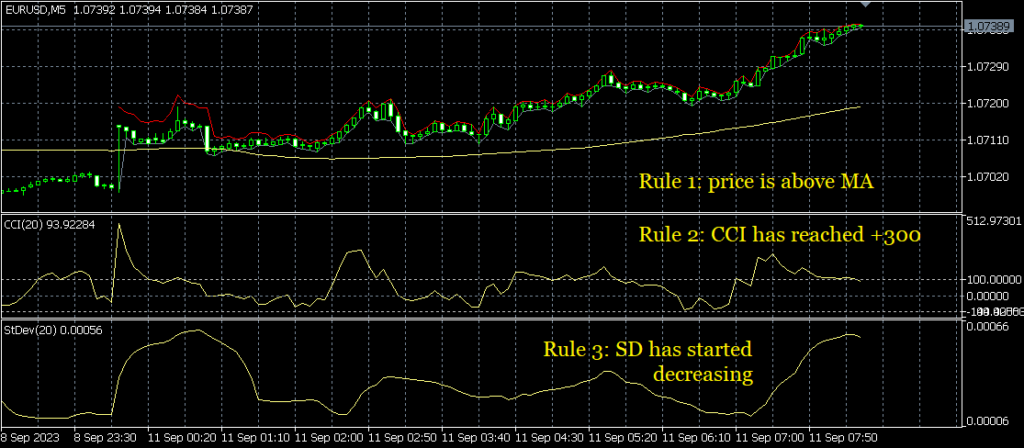
In this situation, we have two choices: either skip this scenario or set the stop loss just above the current price, at approximately 10% of the distance between the price and its average value. However, given that we are in a simulation environment and our objective is to learn through trial and error, we opt to place the order with a 10% stop loss:
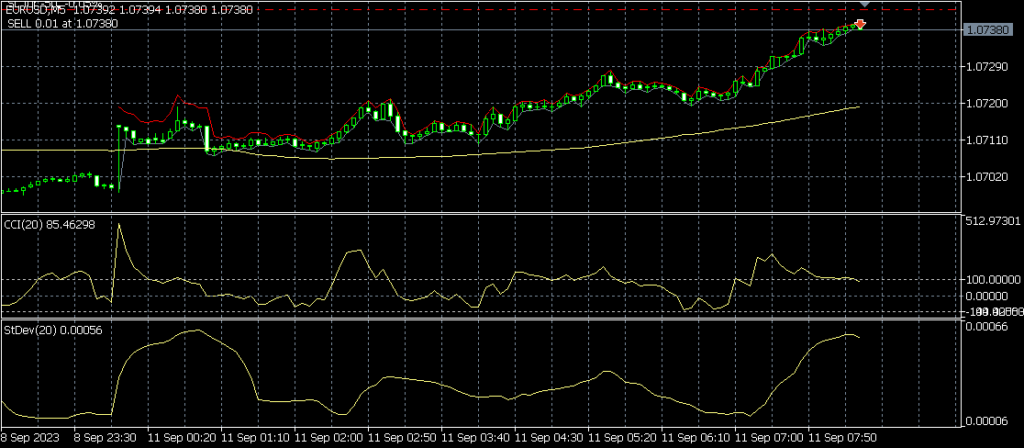
Now, let’s wait for the exit:
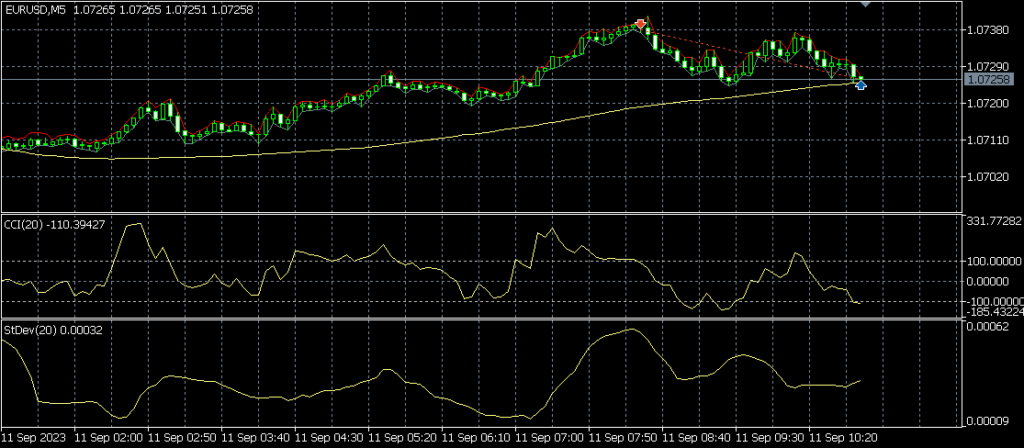
Despite being profitable, this use case feels misaligned, mainly because the price didn’t sharply increase (visually); we merely met rules 1, 2, and 3 formally and set a somewhat arbitrary stop loss.
Let’s proceed to another entry:
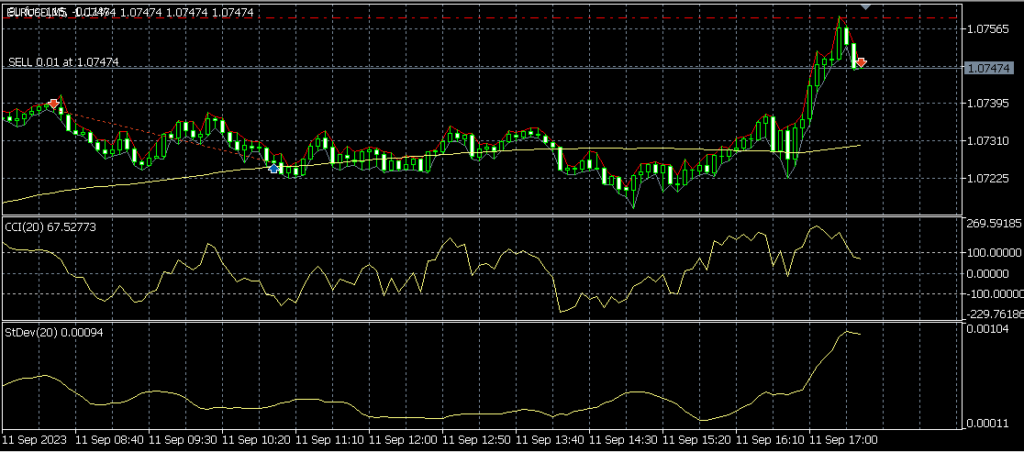
End exit:
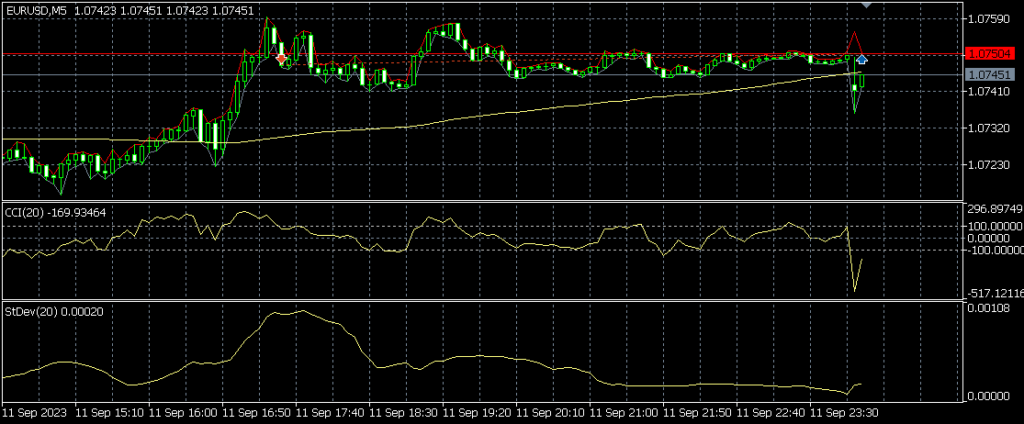
Now, in this new scenario, rules 1, 2, and 3 are satisfied, but the price isn’t dropping sharply, and there’s barely any margin for a stop loss. Should we enter this trade? Let’s give it a shot:
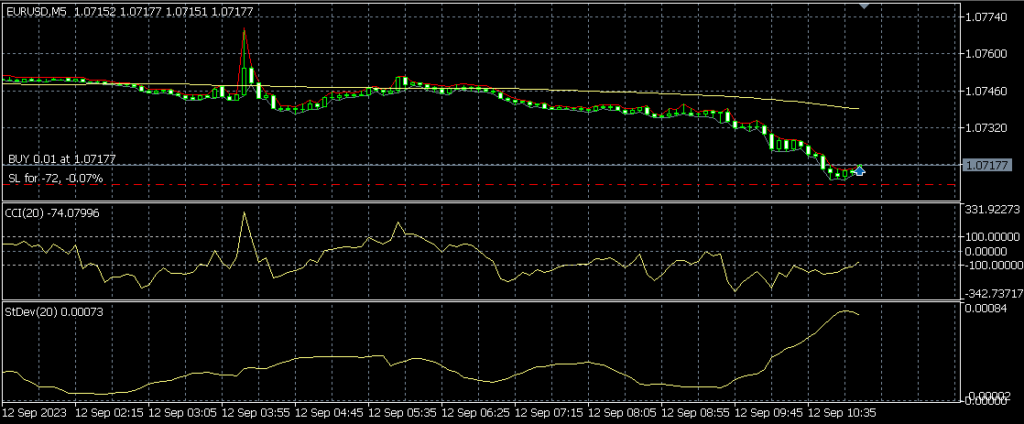
And here is our result – we hit stop loss:
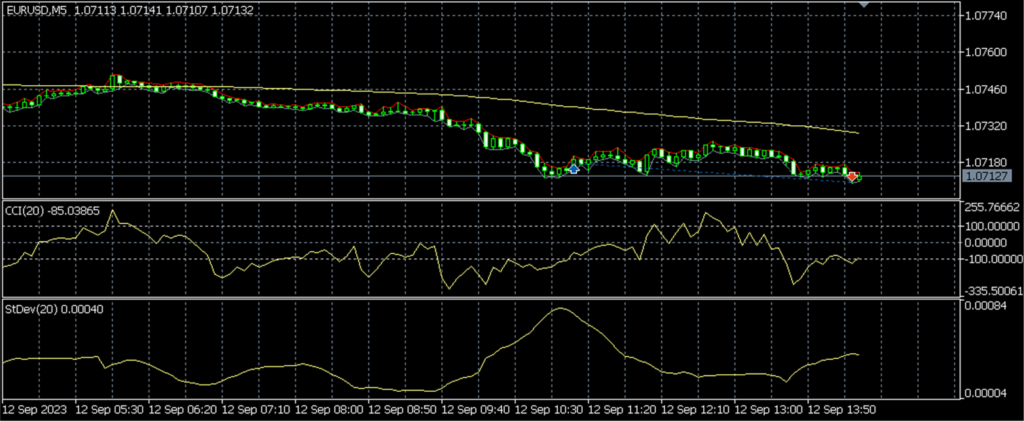
Another use case, the CCI indicator crosses +300, SD reached local max and has started descending:
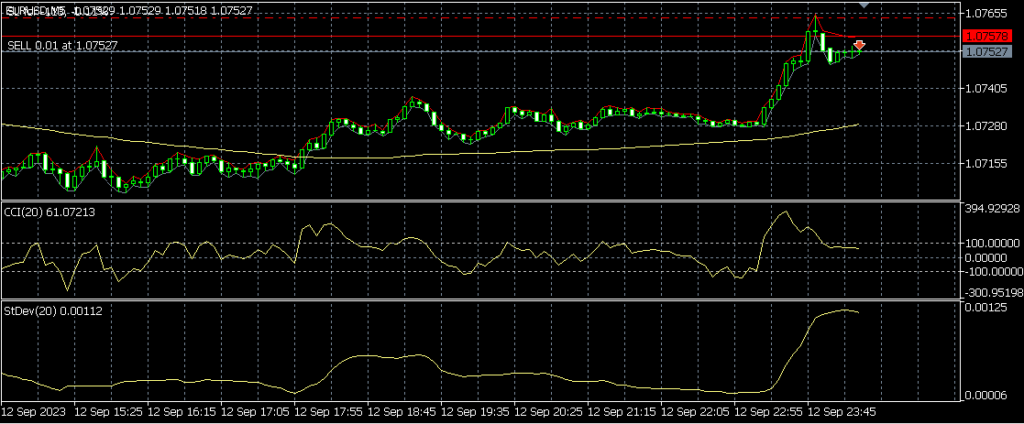
But we hit stop loss almost immediately:
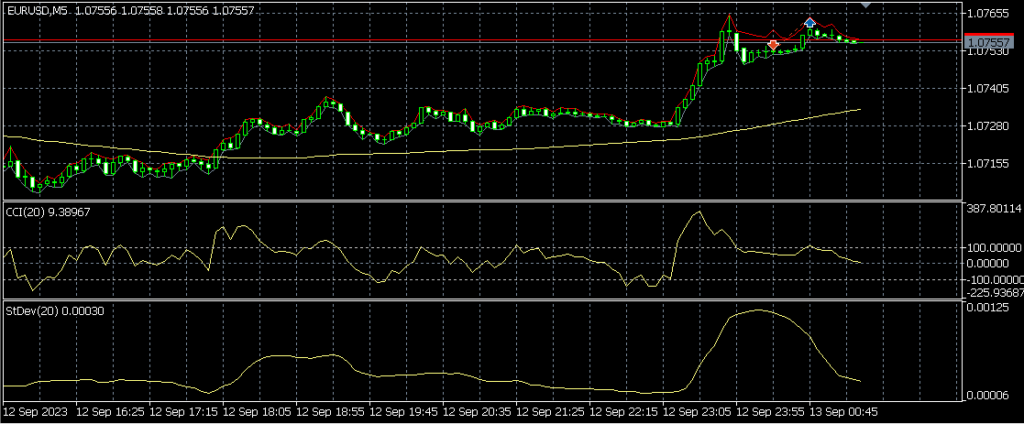
Here’s another interesting scenario: all our rules are met, yet there’s significant volatility, likely due to important news. In this case, I suggest we steer clear of this situation:
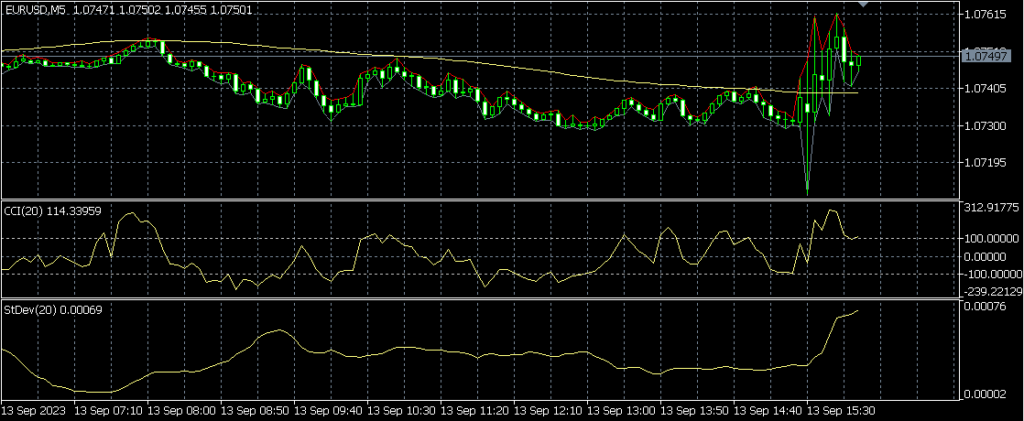
Another highly volatile situation, which I decided to skip:
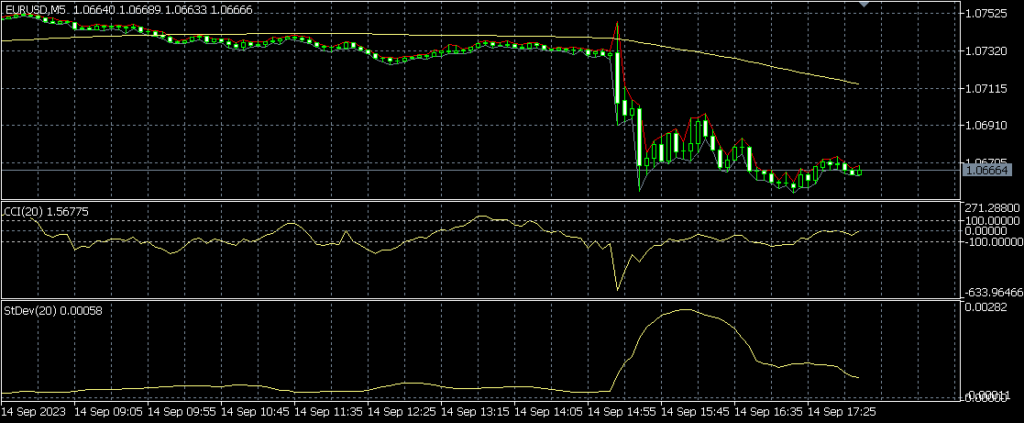
One more profitable trade:
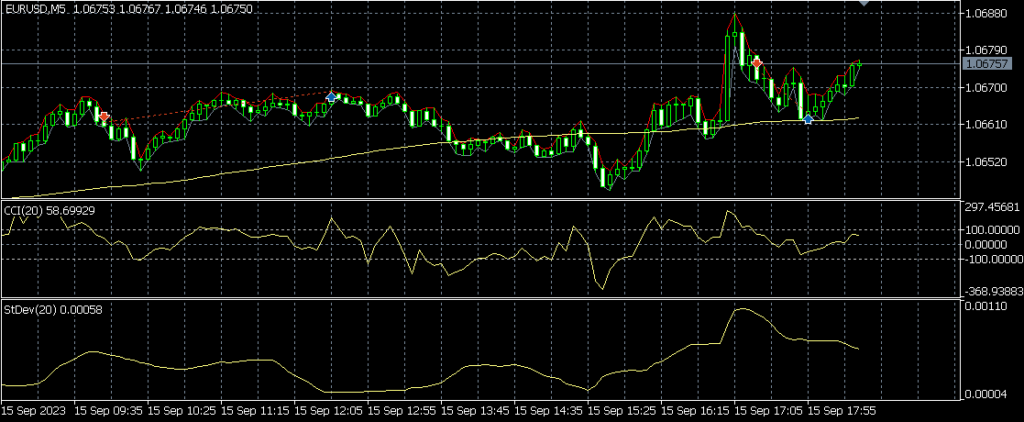
One more trade that hit stop loss:
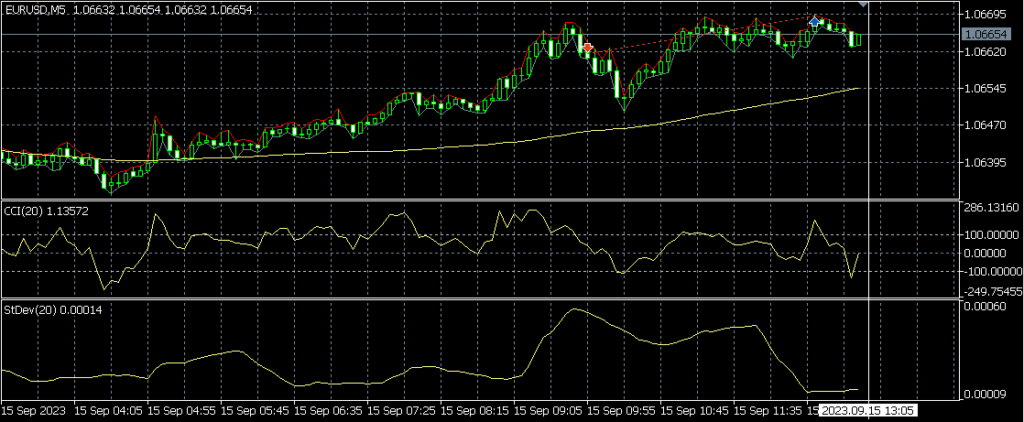
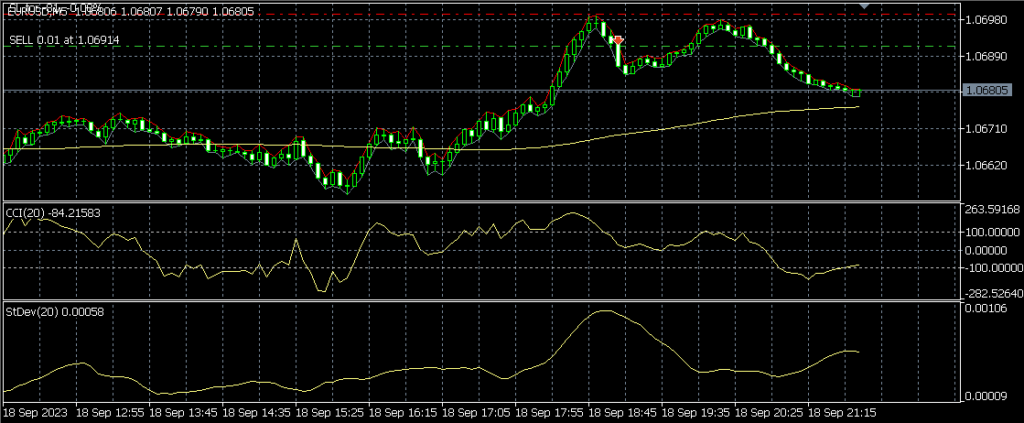
The trade nearly met the exit condition before reversing and triggering the stop loss. At this point, I’d like to apply a break-even rule: if the trade gains an amount equal to the original stop loss distance, then I will move the stop loss to the break-even level.
Here is a scenario where I would adjust the stop loss to the break-even point:
In DT-Box I select open position and click Modify:
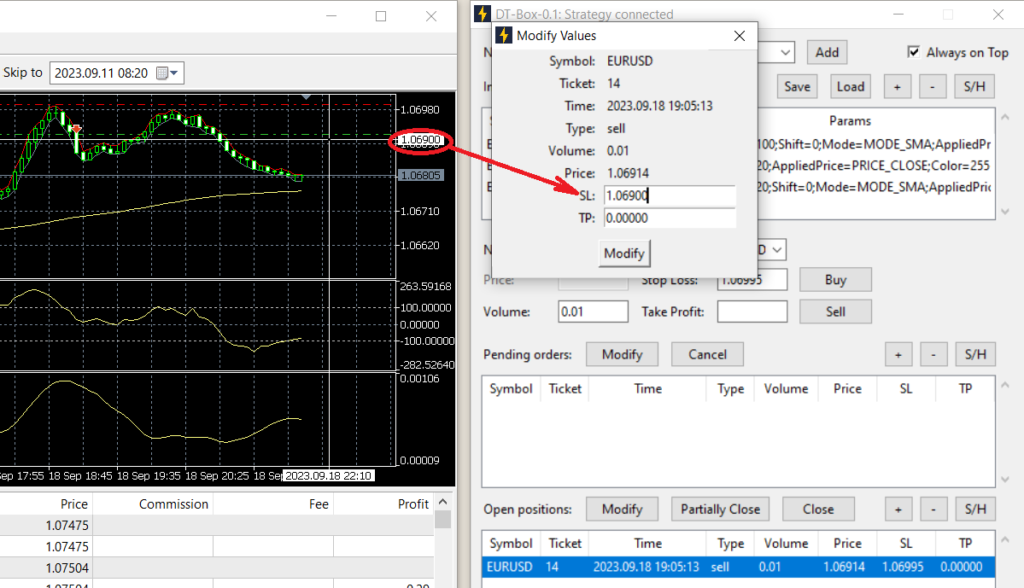
Then, I input the necessary stop loss price and click ‘Modify’. Here’s what happened:
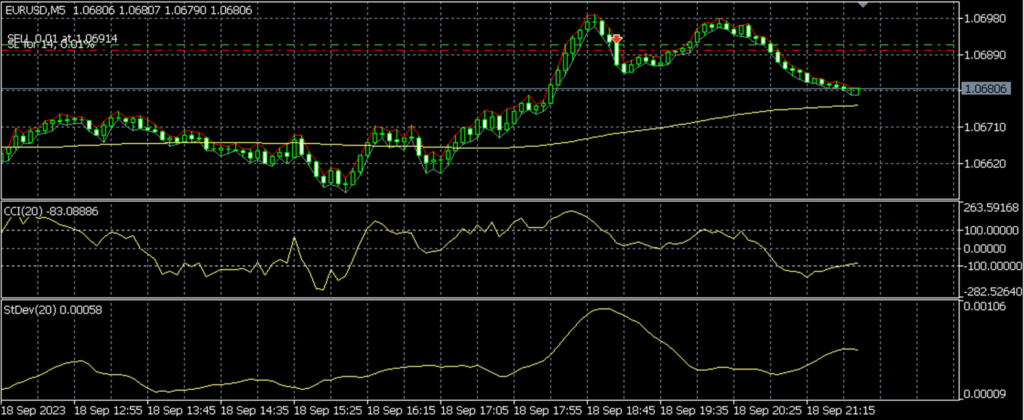
It turns out to be effective: the price increased, and we closed at break-even due to the stop loss.
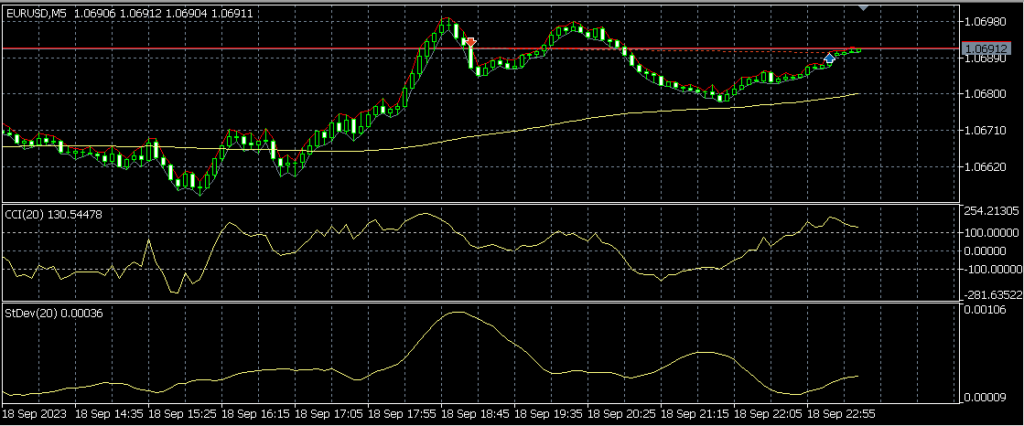
We can also implement a rule that if the price comes sufficiently close to the average level, we can close the position without waiting for an actual crossover.
Another profitable trade followed:
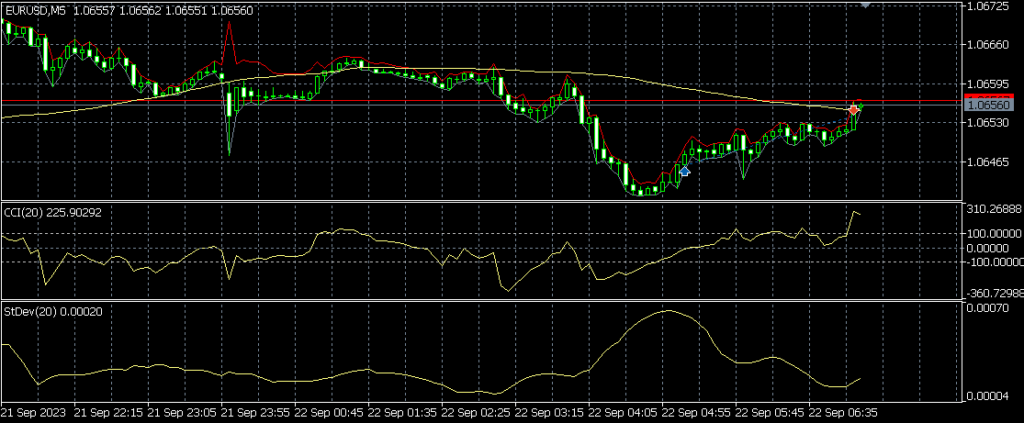
One more profitable trade:
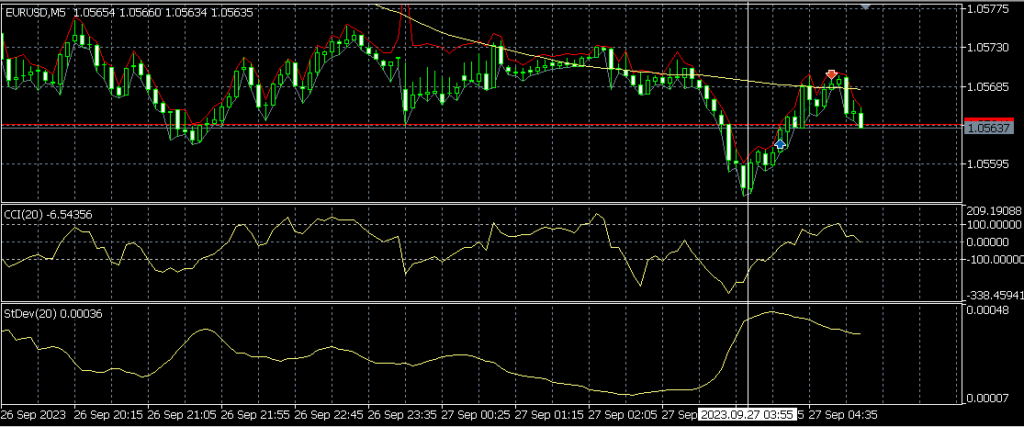
One more perfect example of a profitable trade:
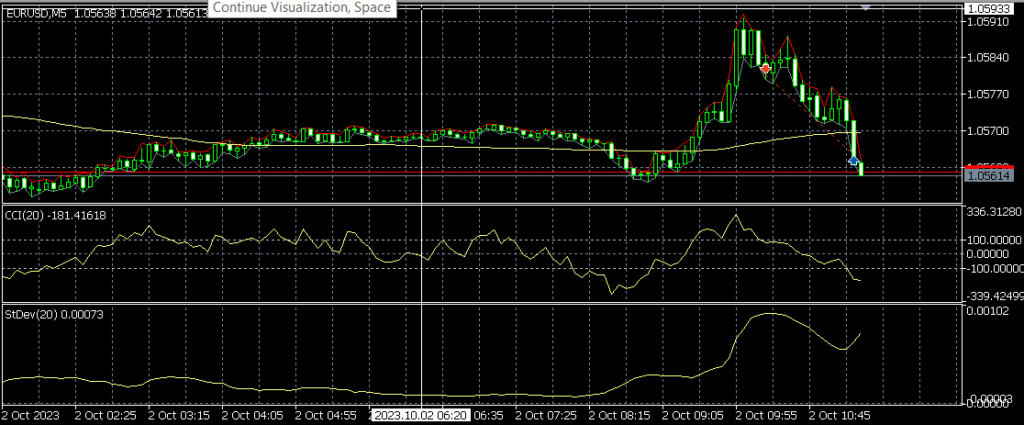
Through this process of trial and often error, I continually test my rules or experiment with new ones. After several iterations, I’ve established the following additional rules:
Additional Rule (AD) 1: Do not enter a position if there is no room for a stop loss.
AD 2: If the price approaches the average level too slowly or rebounds, close for any available profit.
AD 3: The CCI’s maximum (or minimum) and the peak of the SD should be close, within, for example, 3 bars of each other.
AD 4: The price must cross above (or below) the average level shortly before the CCI reaches its peak above 300; the crossover must align closely with the previous rule.
AD 5: Avoid entering a position when the price is closer to its average level than to its stop loss.
AD 6: Exit the position if the price crosses over the entry price several times.
AD 7: Do not trade during periods of high volatility, such as around major news announcements.
AD 8: After a stop loss is hit, take a break for a few hours before re-entering.
Step 4 – Comparing Results and Testing on Out-of-Sample Data
Now that we have our trading model clearly defined with a set of entry and exit rules, along with additional criteria, it’s time to validate it using out-of-sample data. For educational and practice purposes, I utilized the period from September 1 to October 31, 2023. For the out-of-sample testing, I will examine data from the subsequent month, November 2023.
But before we dive into the out-of-sample results, let’s review the outcomes of the consecutive experiments. Here is my very first experiment PnL chart:
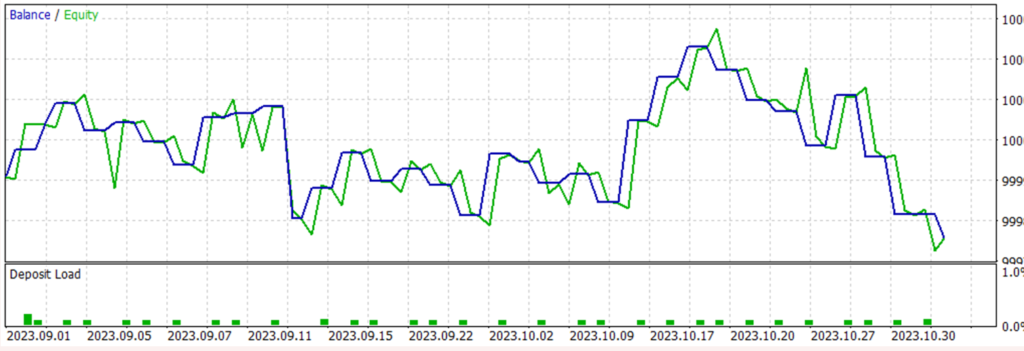
This is my second backtesting experiment on the same data but with all new rules:
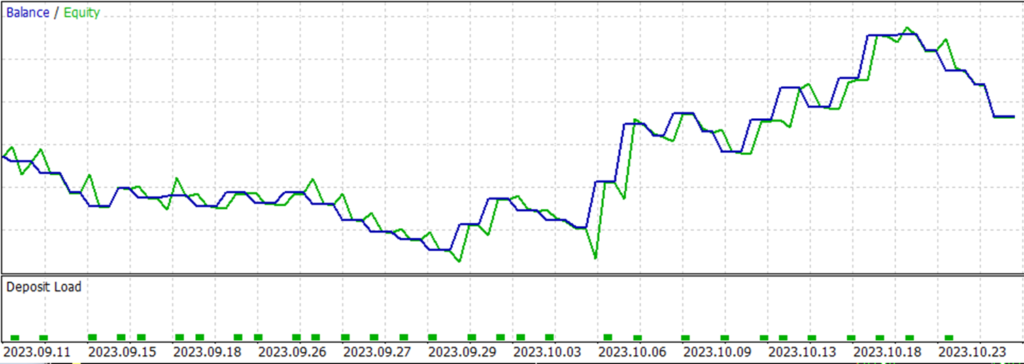
This was my third experiment where I applied all my rules more precisely:

Next, I conducted an out-of-sample experiment using pricing data that was new to me, from November 1st to November 14th:

Next Steps for the Strategy: Automation and Optimization
The next phases for this strategy include its automation and optimization. There is a strong likelihood that through the optimization process, new rules will emerge while some may become redundant. However, the rules we’ve identified and established through the trial and error process will greatly streamline the development and fine-tuning of the algorithm. After all, you now have a clear understanding of how each signal appears on the chart and which steps more likely lead to better results.
Conclusion and Key Takeaways
In this article, I provided a comprehensive walkthrough on using DT-Box to create and refine profitable trading strategies. Crucially, through this straightforward example, I demonstrated how you can enhance your trading concepts and models in just a few hours by manually testing them with replayed data and observing the results. As highlighted earlier, this hands-on approach yields far better outcomes compared to merely automating initial ideas, which typically result in only slight enhancements. By actively testing and refining signals, you’re more likely to establish improved, more effective rules and as a result – profitable trading strategies.
Looking ahead, I plan to present additional use-cases related to idea validation. Regarding DT-Box, enhancements are on the horizon, including support for algorithmic orders, integration of custom strategies, and the capability to manually initiate them during backtesting experiments. Stay tuned!
Additionally, if you have any questions or ideas related to this article, please don’t hesitate to contact me at pavel@pavelchigirev.com. I’m eager to hear your thoughts and feedback.